History Data Collection
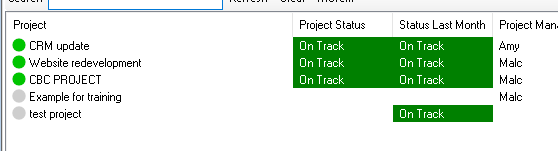
Properties are collected automatically at the project level. Some of these are properties you set up in System Project Properties, others are generated automatically based on the Plans, Risks and Issues sources you have in a project and yet further ones can be sent from Spreadsheets held in a project. All these properties are Project properties that is to say they are stored per project i.e the number of open risks in the project or the project spend. The central system keeps a data table of the latest value of each of these properties so they are immediately available for reporting and display purposes. Since version 5.2 a new Property History table keeps this same property information but with additional timestamps. Therefore everytime a property changes the new value is stored with its date/time alongside the preceeding value(s). This process is entirely automatic and will happen for all the project properties running on a particular project. Note: these are not automatically stored every month or at some other fixed timepoint, instead when you want to analyse or report on them the software offers you time binning which can choose which point to show when multiples are available ina time period (i.e. last in month). The Software can also fill in missing periods when charting using options you select i.e. 'use last data point'. There is no direct control or form to see this raw data. The system also automatically creates one additional property on your behalf. Status_lastmonth. This automatically generates a value for the status last month, the calculation is stored in code and cannot be altered. If there was no status updated/entered during the last calendar month it takes the last value it can find as an update. If there are multiple values in the period it takes the most recent. If the status has never been set it perpetuates that blank entry.
|