Trend Analysis
Trend Analysis is a major new area of functionality added in Version 5.2. It creates a data store of properties and keeps track as they change over time.
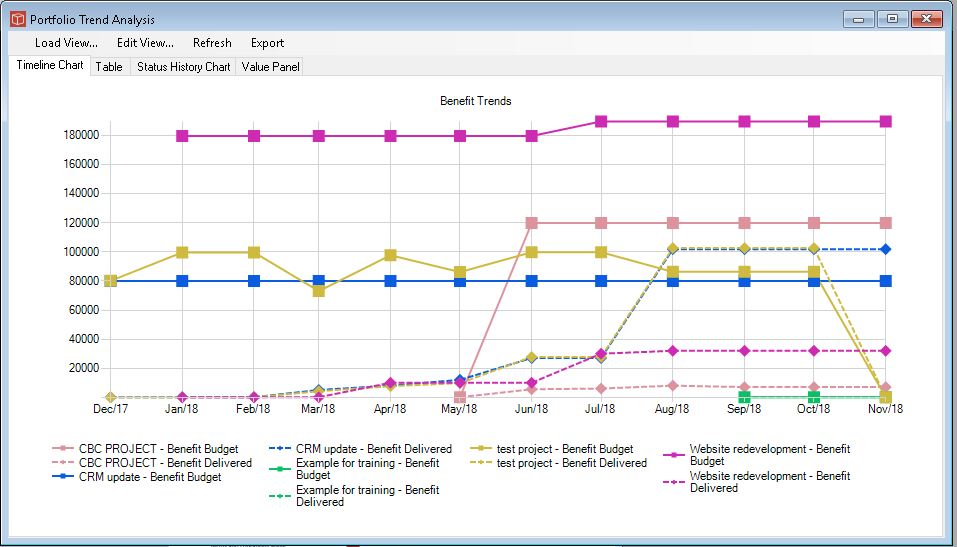
The data collected can then be used for creating trend analysis either using the new forms in the windows app and browser app or in reports. This facility is provided in both Project and Portfolio reports. This trend Analysis form allows trends to be produced live in the application. At its simplest simply use load view to select from the pre configured views. Remember each view may show a different display type so you may have to tab to see it. You can also edit views to create a custom one and save it to the View library if you wish.
Timeline charts and tables and status history tables can be used in the application and the reports. Value Panels can only be used in projectect analysis and reporting. More about history data collection |