Value Panels
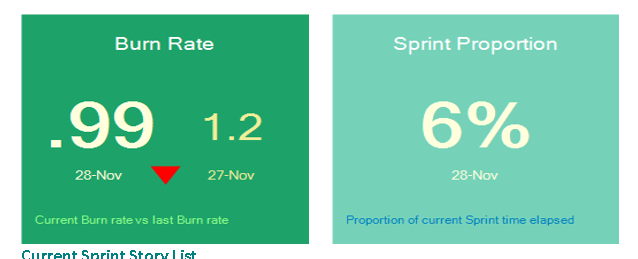
The Value Panel is one of the Trend Analysis types available in PIAB. To configure it you will need to use the generic tabs which form the Trend view management and then focus on this specific tab here calledValue Panel which we look at below. Firstly this is what our output might look like with two panels next to each other in a report.
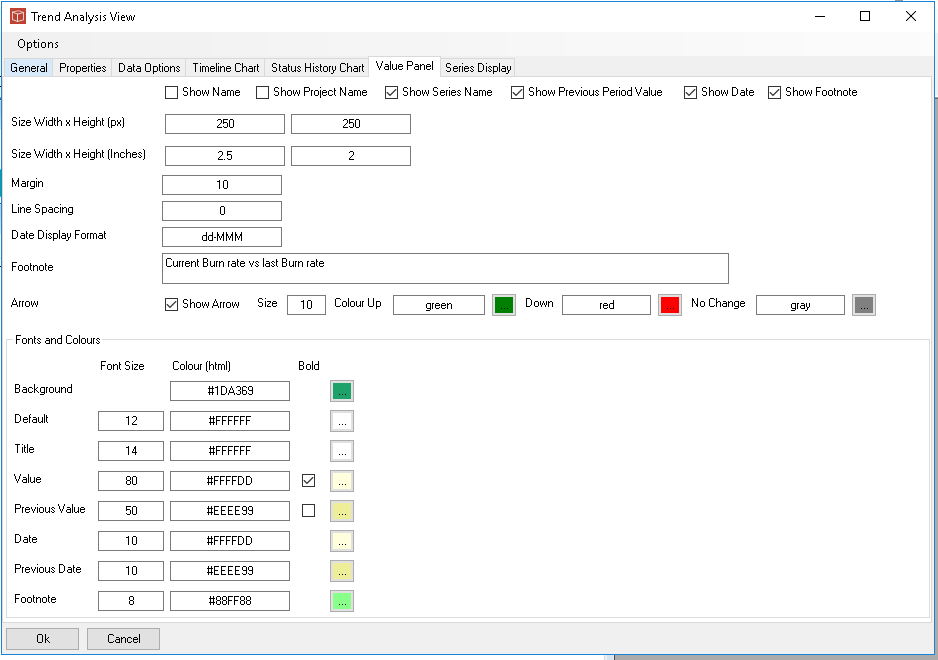
The tab for working specifically with the Value Panel is shown below and the output for this case is above left. Firstly a set of tick box options about what to show, you can show the current and last period values or just the current value, also names, titles, footnotes etc. Then you set the size of the panel, firstly in px and then an optional scale for showing in word (0 gives a dfault scale). When showing current and last period values you can optionally include an arrow and then set the colours for the arrow depending on direction. At the bottom of the form you then get to set all the colours and font sizes which make the panels work well.
Even if your data options are set to more than two periods you will only get max to periods shown in the Panel, here the bins are set at daily. |