Multi-Portfolio Report
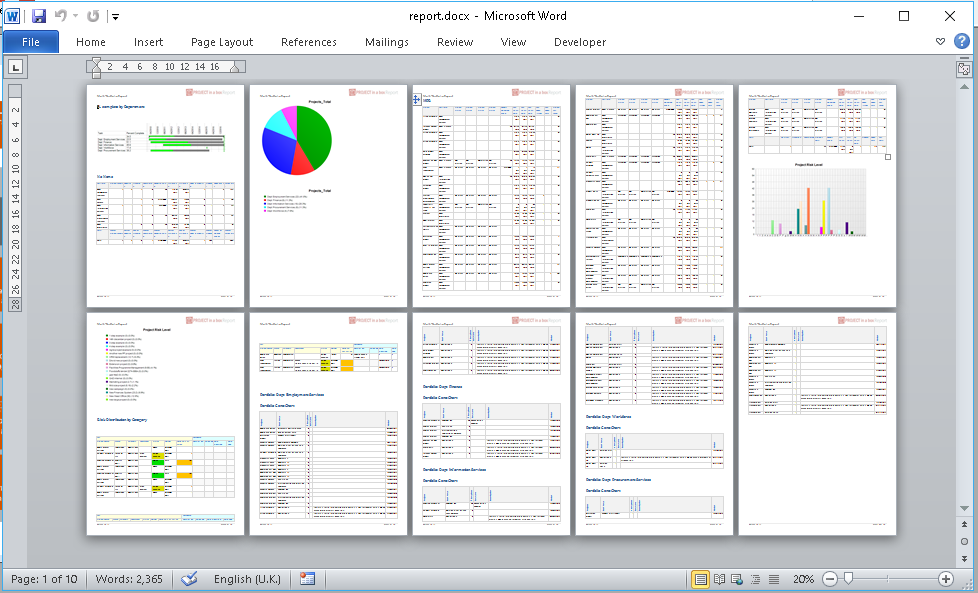
The Multi-Portfolio report enables you to generate a report which brings together data grouped at the portfolio level and also with some data presented from all the underlying projects. The MPR report is available to Manager licence users with Edit permissions on Portfolios and is accessed from the Reports main menu. Generated reports may look like this (word example):
Major sections can include:
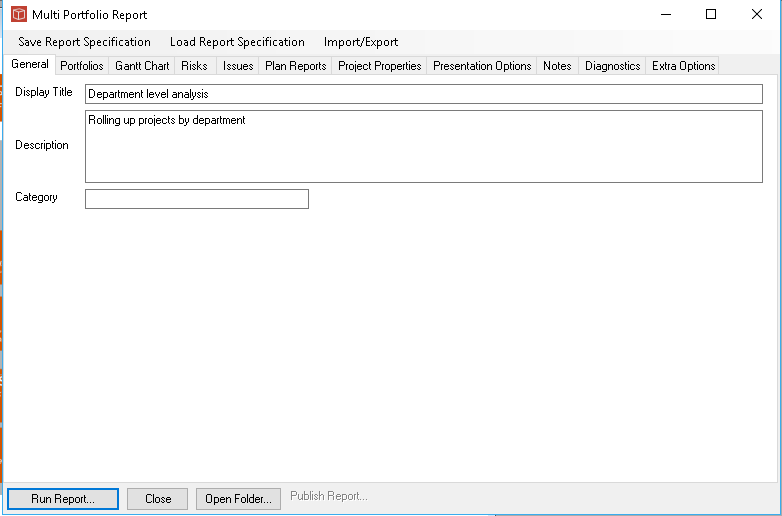
When opening the MPR form you start on teh General tab which gives the saved Title, description and Category for this particular MPR report. If you are working up a new Specification to save you can adjust these. Open an existing saved specification using the link at the top of the form or save one using the Load link. Import/Export options are alos supported for paste to copy or add from paste like in other report management forms.
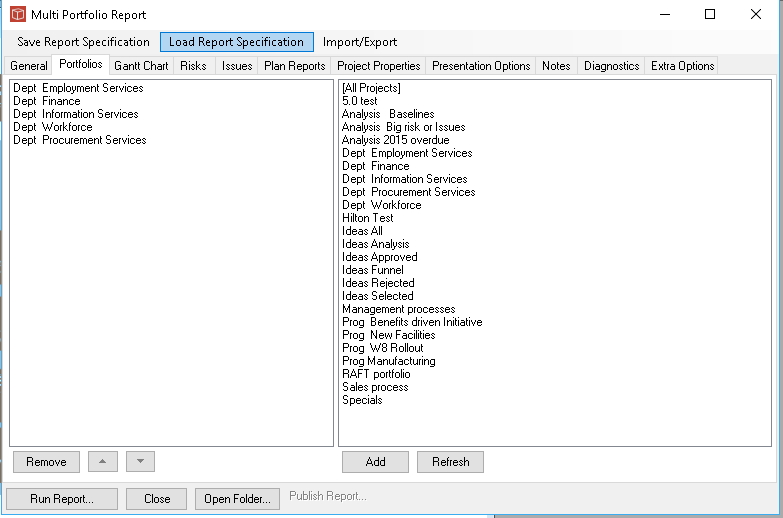
On the second tab you can choose the portfolios you want to be used in your report. Please note this works differently to the Project and Portfolio reports which use the currently selected projects and portfolios, here however as you are usually choosing multiple Portfolios you select the ones you want and these are saved as part of the MPR specification. Select the Portfolios from the list on the right and add to the list on the left which will be active in this report. Your lists will only show Portfolios you have permissions on.
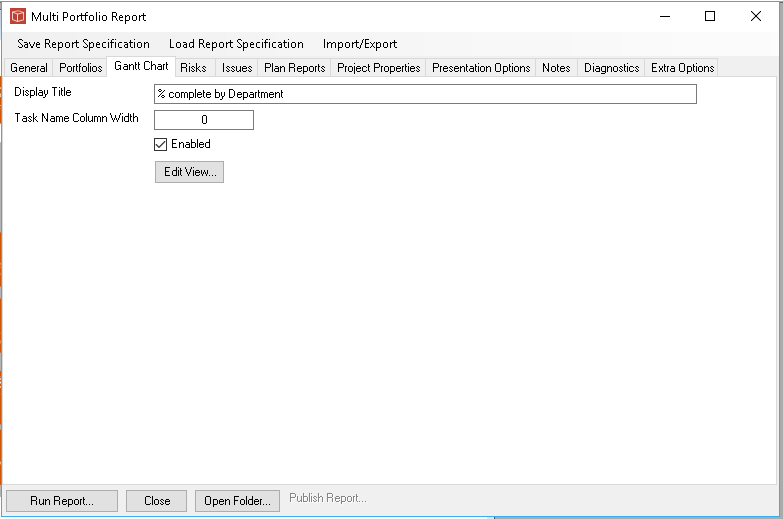
On the third tab you can set up the MPR Gantt element. This will roll up all the task data within the projects of each chosen Portfolio and generate one output task start and end date and percentage complete. If you have chosen Multiple portfolios you will get multiple task bars and also a summary which rolls up the data as well. You can set the title for this chart, its task name column width and other aspects, colours, sizes, formats etc are controlled by the view (using edit view).
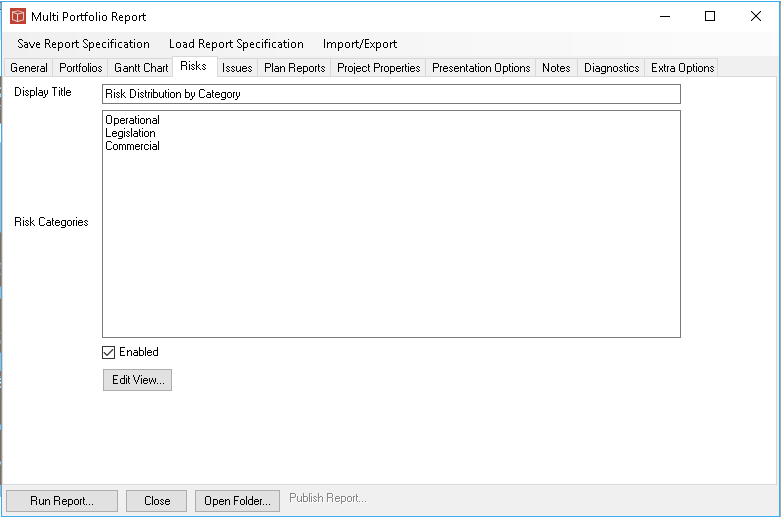
The fourth tab supports the setting up of Risks into the MPR. You can give your report section a title and then choose the risk categories you wish to display. In the output report each category will get a separate table showing risks from across the full set of Portfolios which match that category an view requirements. The tick box allows you to include or exclude this from the completed report. Category names have to be an exact match and activating the report Diagnostics can give you the list of Categories present in the data so you can copy/paste the ones you require to display. The view can be used to filter and choose how the display will be formatted. The fifth tab for Issues works in exactly the same way as Risks except you choose the types you want to display.
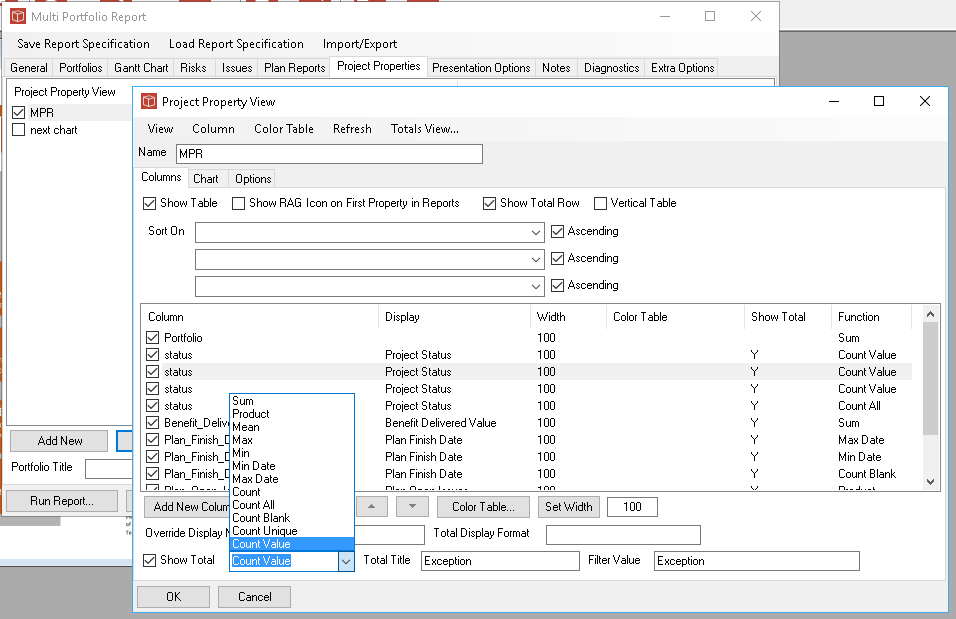
The 6th Tab allows you to package up properties data for display in the MPR. As with other reports you can set up multiple different views and activate/pause them using their in-line tick box. The Add, edit, delete and reorder buttons at the bottom of the form control those activities. This is shown below with a particular view opened up. The project property view form allows you to select which properties are yo be displayed, in what order and with what treatment (colours, totals etc). Specifically for the MPR you can now specify a range of different total types and also give these titles as in the example below where the total of the Status column is count where status =Exception has a title of 'Exception'.
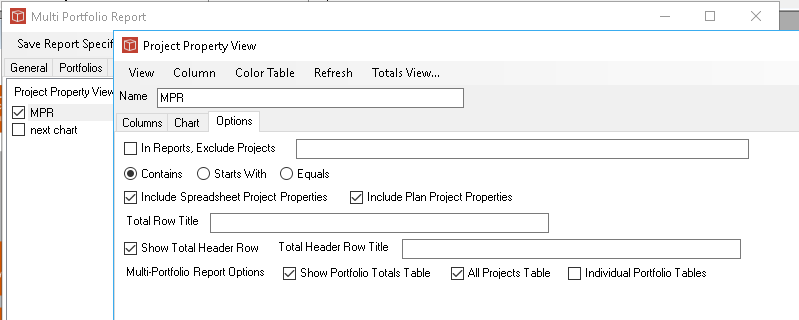
This view definition can be displayed a number of ways in the report using the options set up on the Options tab (and shown here below). The three bottom tick boxes controll as follows:
Of course these three different formats can result in different totals because in 1 and 3 a project which appears in multiple of the portfolios will have its data double counted in totals.
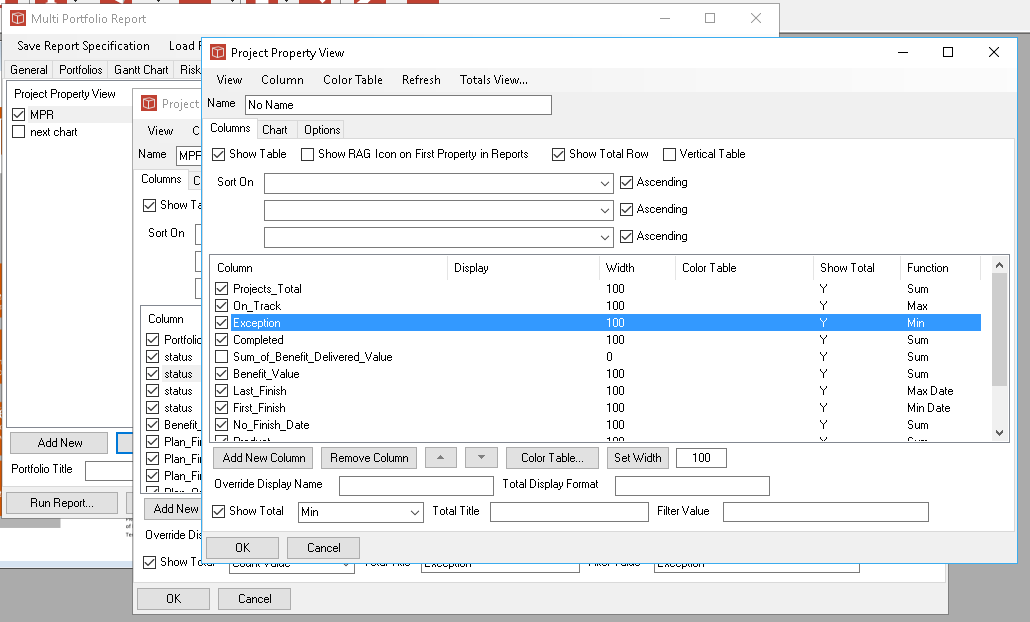
When using the Totals View link to manage the Portfolio Totals Table you get a near identical project property view which opens to define the structure and set up of the Totals table. This is because the other two tables (2 and 3) show data at project level and a total eithr for th particular protfolio or the sum of the 'total' projects. This table though shows the data for the portfolio totals in rows and then a summary/totals row Below that. the data types and labels here will need to be different. You can see this further form opening over as shown here below. Note that the columns used in this Portfolio totals table differ to the ones used in the usual property view table. essentially here you will use the totals from the original properties table. To set up the table you use the add new column but rather than picking from the properties in the list on RH side you add the name of the 'total' property you want. This is why giving your total/summary entry a name in the earlier property view was very helpful.
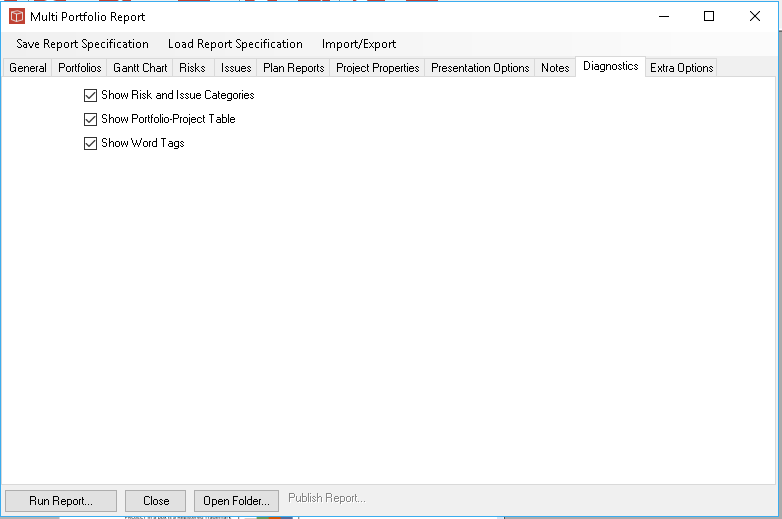
The 8th tab allows you to choose the report template and output format of the report, this works exactly the same as it does in the other Project and Portfolio reports. In the 9th Tab you can keep notes about how you ahve built the report, about how you expect it to be used etc. This MPR is more complex to set up than other reports and accordingly the tenth tab gives you the ability to include some diagnostics in the generated report. Set the presentation output to Browser and select the type of Diagnostics you wish to include: Risk and Issue Categories provdes the exact category names to you can copy them for use in the Riska nd Issue set up tabs. Portfolio table shows you where any project duplications exist across the portfolios you ahve selected. Word tags gives you the tag names you will need to use if setting up a word poster style report.
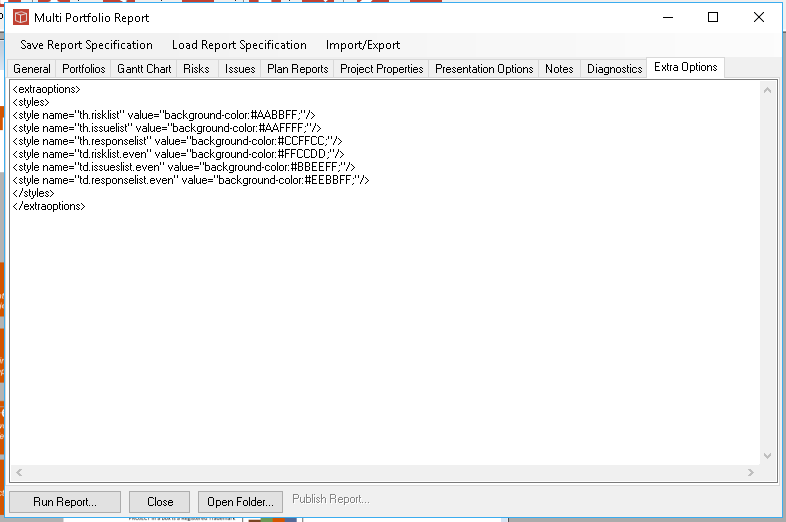
The 11th Tab has space for optional codes to be used by the report. Currently this is just limited to providing style backgrounds for the Plan data tables using the format you can see below here. This is very helpful because with the new inline responses these tables can become complex.
|