Portfolio Report
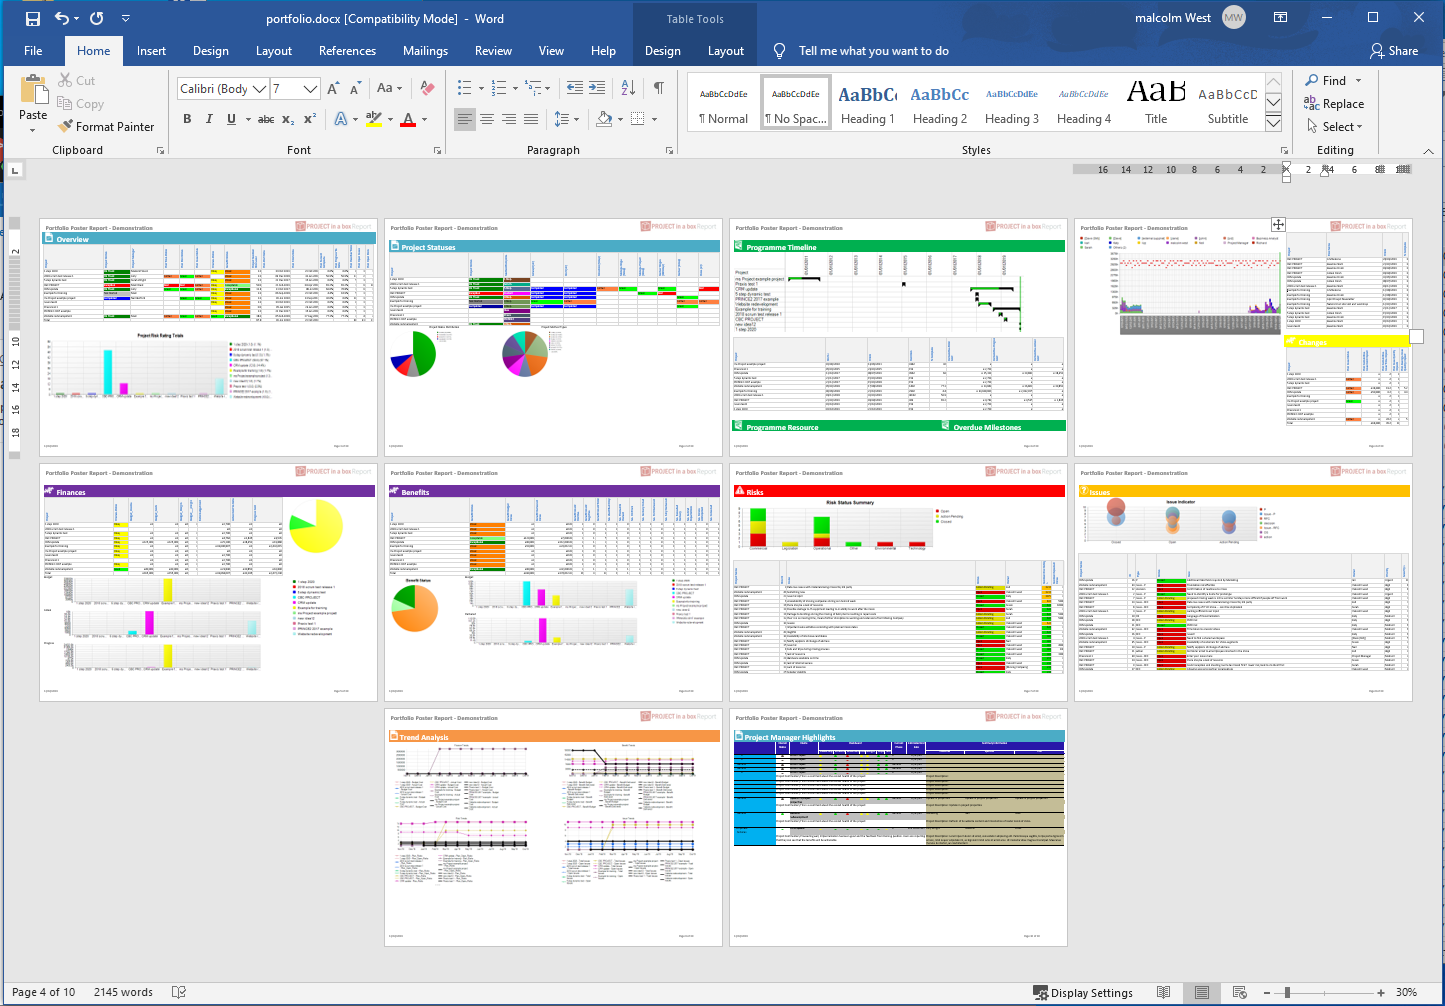
The Portfolio Report wizard enables you to produce a report on the current state of your projects within the current portfolio. The output can vary significantly depending on the choices made in particular about which Report Template to use for the Presentation of the outputs.
When generating a Portfolio report you have the choice of using an existing Portfolio report template, editing an existing one or creating a new one from scratch. To create a report using an existing Portfolio report template use the Load Report Specification menu item and pick a specification from the list, this will populate the form with all those saved settings and you can then use the Run Report... button at the bottom of the form to generate your report. The Notes tab will give you some guidance about what your report will produce and how it can be edited.
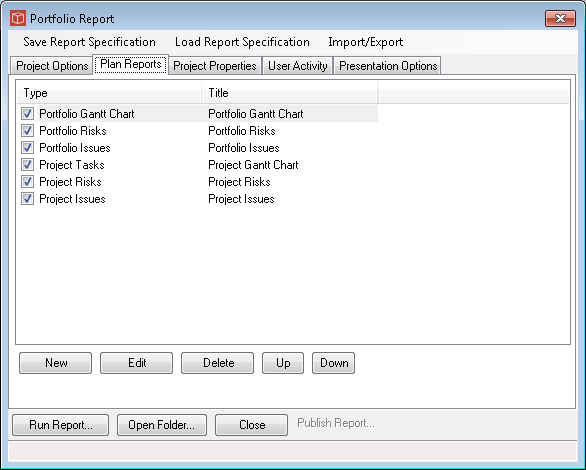
If you want to further personalise your report contents and presentation or create a bespoke one then you can work your way through the options in each tab of the form as follows: In Project Options you can select the data types to be included in your report using the tick lists available. You can also provide the description and category information to help your colleagues decide if this is the report format they want to choose to use. When one of these items is selected the report will get what ever data is set up in that area of the project's PSI form. Note that the Include Project Reports option only relates to when reports are run to a Word output and they will then include a separate project report element for each proejct in the portfolio beneath the Portfolio output. In the Project Controls/Plan Reports Area as shown below you can set up data analysis from the project controls database content for this Portfolio. Use new to add an item to the list and select the type you want (as well as task, resource, risk and issue there is also the ability to specify the portfolio and project levels). Note if you specify for example just Portfolio Risks then drilling down to the project reports they won't have any risk data. If you just specify project risks then the drill down will have data but the Portfolio report summary sheet won't. Once these blocks are set up here in the list then edit them in turn to control what is shown, this is using the View, you can either load an existing view from the managed view list and then personalise it or create a bespoke one.
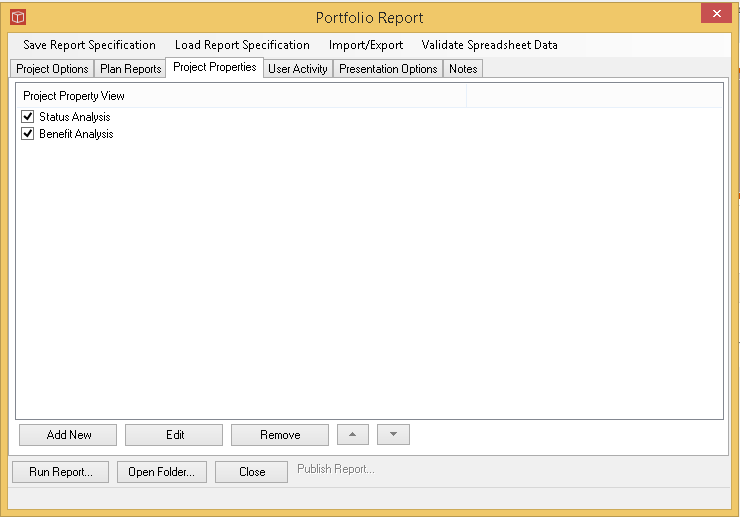
Project Properties - As shown below any number of property views can be set up to produce grids of data based on the properties held for the project. These views can include Built In properties, System Project Properties, Extended Properties from the method template, Project Controls properties from the database and properties loaded from spreadsheets held in the projects.
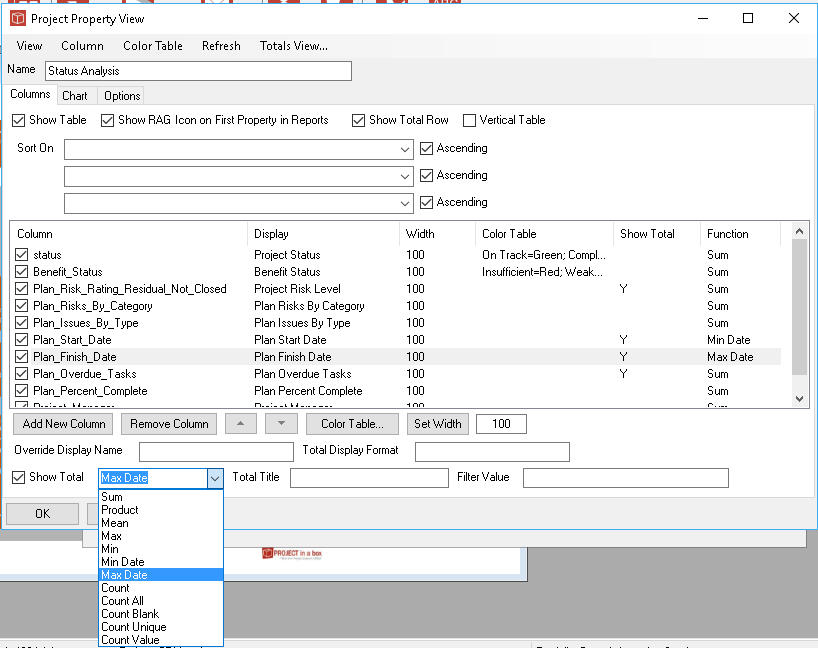
Each view can be set up using the edit button as follows manually or by loading an existing saved view from the saved views list. Set up options includes charts and further advice on this is available here. If required a number of preset views can be included in the report and switched on and off as required.
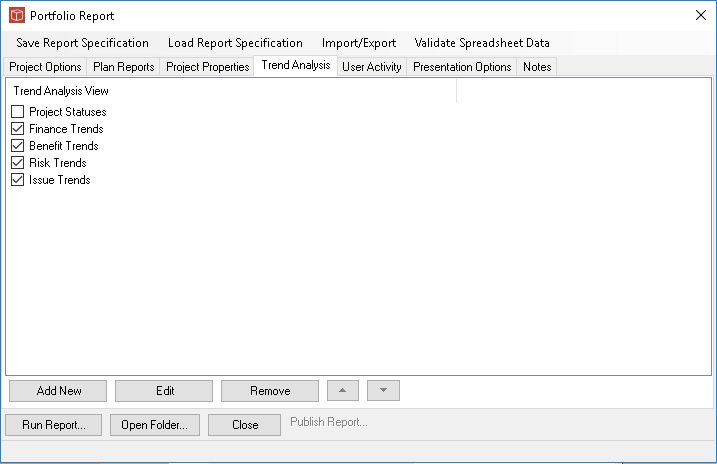
In Trend Analysis you can specify a set of different analysis types and switch these on and off for inclusion in the report. Using Add new to add a blank item and then Edit to adjust it (including loading one of the saved analysis formats).
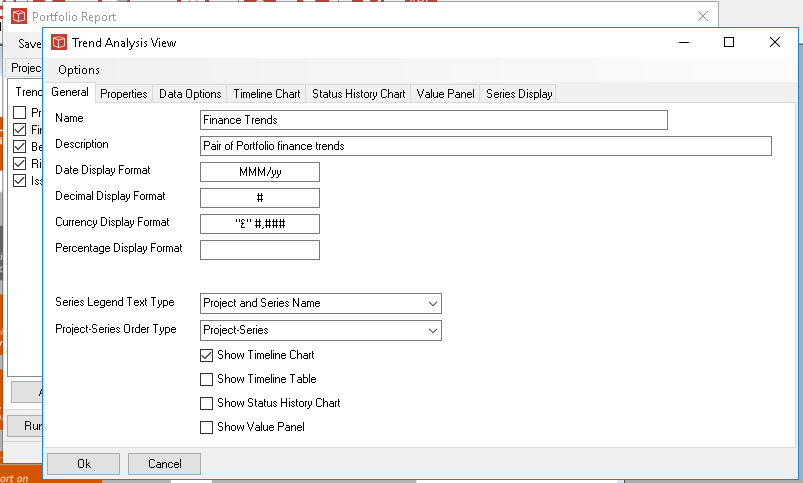
Each Trend opens out into its own form as shown here below, one form controls all the different types of analysis and you use the tick boxes and then subsequent tabs to set up the trend. Further information on this is provided in the Trend Analysis Articles. Portfolio reporting supports Timeline, table and Status history types of charts but not the Value Pane type whih is only available for one Project at a time.
User Activity - Tick to select on and use the date filter if required to narrow the choice of activity data shown. This data is only included in the underlying project reports and not in the Portfolio summary sheet. Presentation Options - These will be included as part of your loaded report specification and consist of the Report Template (the definition, layout and styling resources for the report), the type of output (to html or word) and if word has been chosen then whether a standard report (including all sections specified) or a poster (use the explicit sections and layout prescribed).
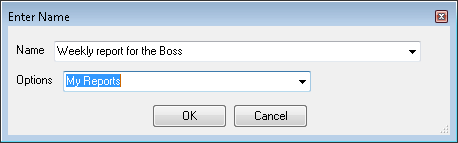
To generate the report use 'run report'. You can also use the Open folder... button here to open the appropriate report storage folder and view previous reports for this project or package a report for distribution. A Publish Report... button is provided at the bottom of the form and initially greyed out until the report production is complete and the output has been viewed, then it becomes a lit hyperlink. Clicking on this link opens the Publish Report form with the source file details of the report you have just produced populated. You can use this form to publish your report to the Enterprise hub for easy sharing with your colleagues. and wider team. Should any of the requested data sources not be available you will be advised of this in a message box before the produced report is shown to you. Once you have a report you are satisfied with the settings will be retained by the form until you change them, either manually or by loading a different existing report definition. To save your current report arrangements use the Save Report Specification item in the menu, give it a name and choose a type (Gobal, Project or My) depending on your permissions. If you are an admin user you can save to any of the three formats and even overwrite the existing specifications, other Modify and manager users can only save to My or Project level report specifications.
|