Project Report
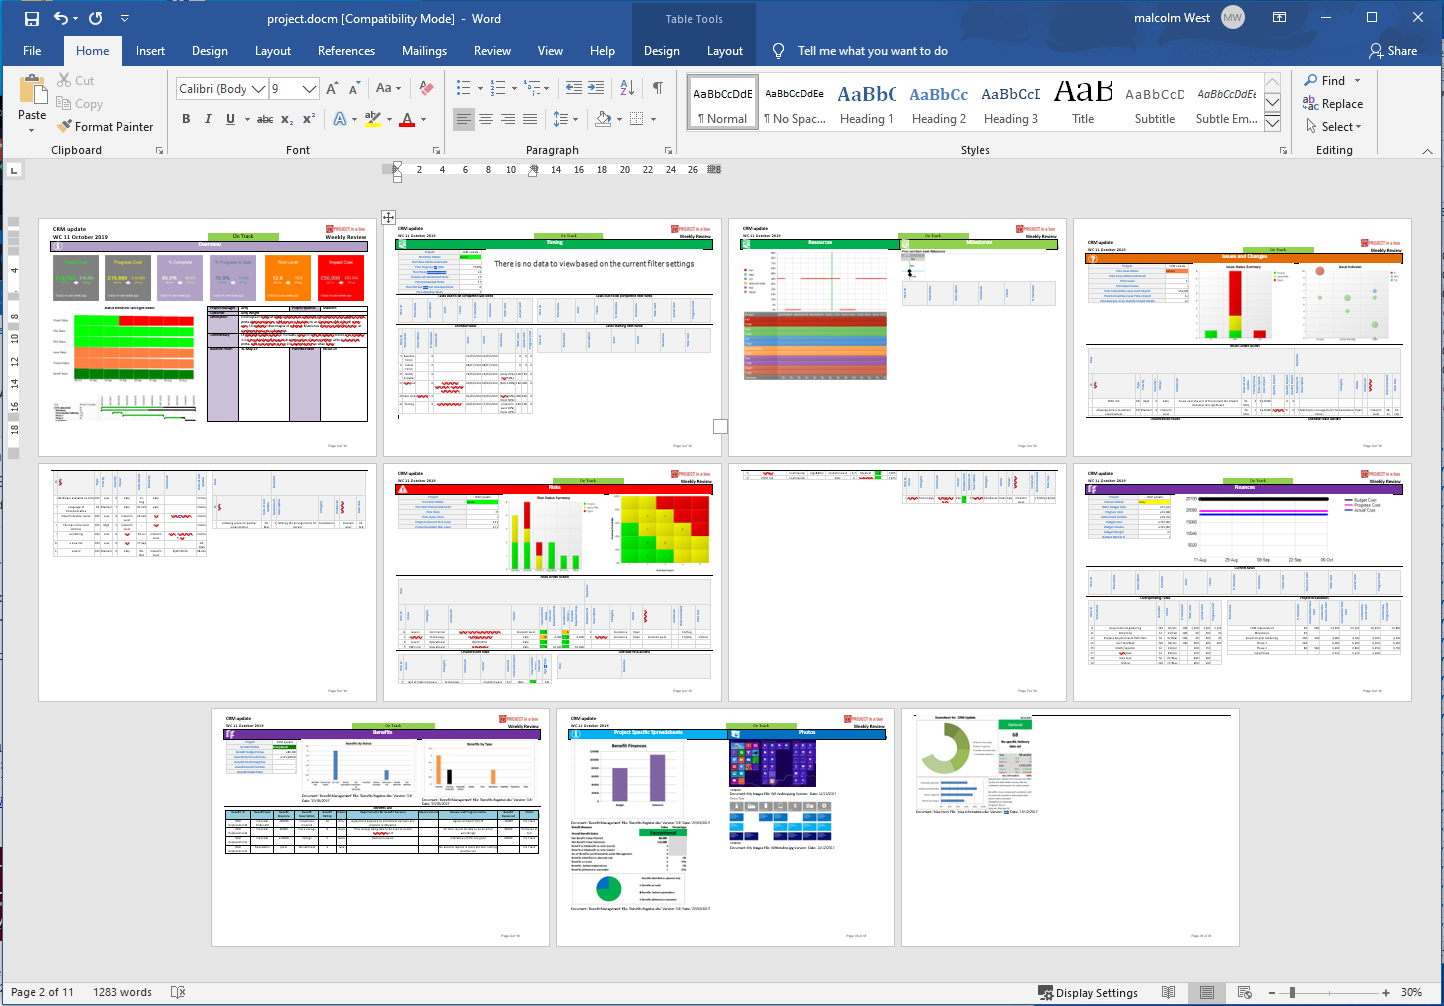
The Project Report wizard enables you to produce a report on the current state of your project. The output can vary significantly depending on the choices made in particular about which Report Template to use for the Presentation of the outputs.
When generating a Project report you have the choice of using an existing saved report, editing an existing one or creating a new one from scratch. To create a report using an existing saved report use the Load Report Specification menu item and pick a specification from the list, this will populate the form with all those saved settings and you can then use the Run Report... button at the bottom of the form to generate your report.
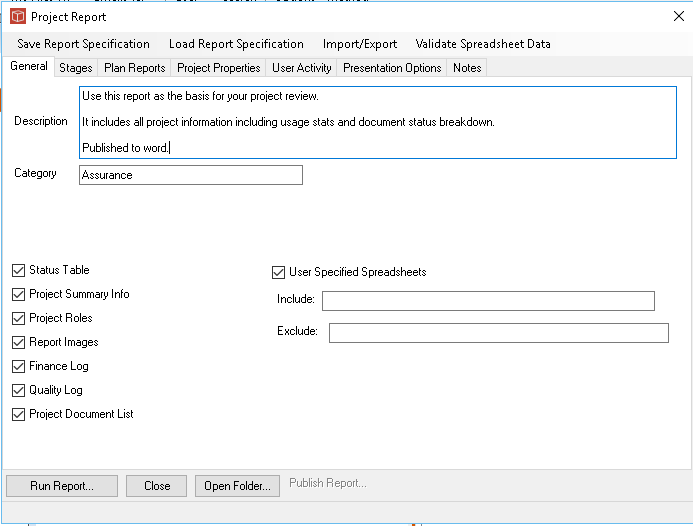
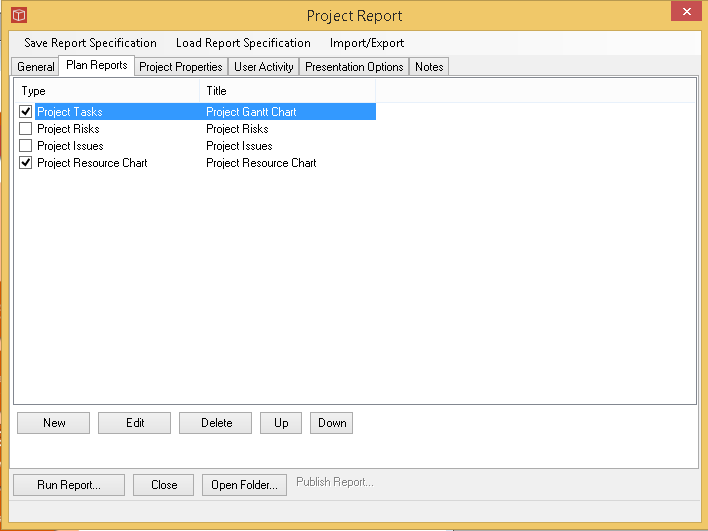
If you want to further personalise your report contents and presentation or create a bespoke one then you can work your way through the options in each tab of the form as follows: In General tab you can select the data types to be included in your report using the tick lists available. You can also provide the description and category information to help your colleagues decide if this is the report format they want to choose to use. When one of these items is selected the report will get what ever data is set up in that area of the project's PSI form. You can either use all the user specified spreadsheets saved for this project (as shown above) or can add a spreadsheet block title (as specified in the PSI form) in the exclude list, to include all except that one or in the include list, to only include that one. Both lists can have multiple entries seperated by semicolon (;). In the Project Controls Reports Area as shown below you can set up data analysis from the project controls database content for this Project. Use new to add an item to the list and select the type you want (task, resource, risk and issue). Once these blocks are set up here in the list then edit them in turn to control what is shown, this is using the View, you can either load an existing view from the managed view list and then personalise it or create a bespoke one.
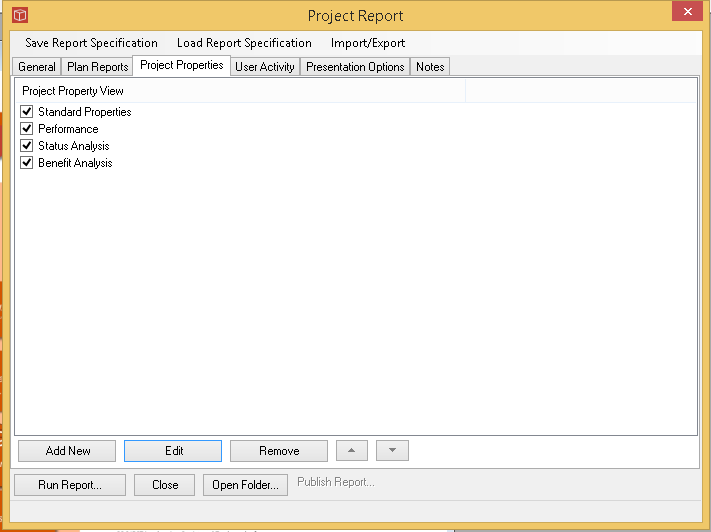
Project Properties - using saved properties views or creating custom ones then have those sets of properties data displayed into the reports. As this is a project report it will just be a single row for the project. In portfolio reports these form data grids for multiple projects.
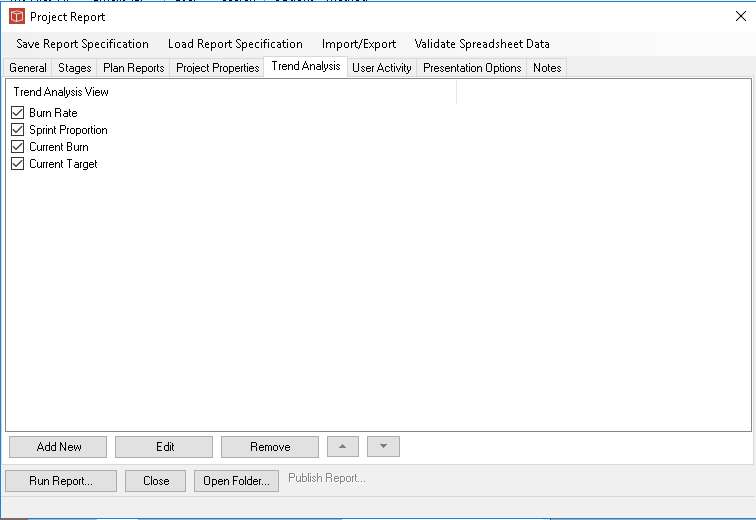
Trend analysis tab allows you to define a set of analysis which will operate on the collected history data for your current project. You can have as many different trends set up as you wish and these can be switched on and off.
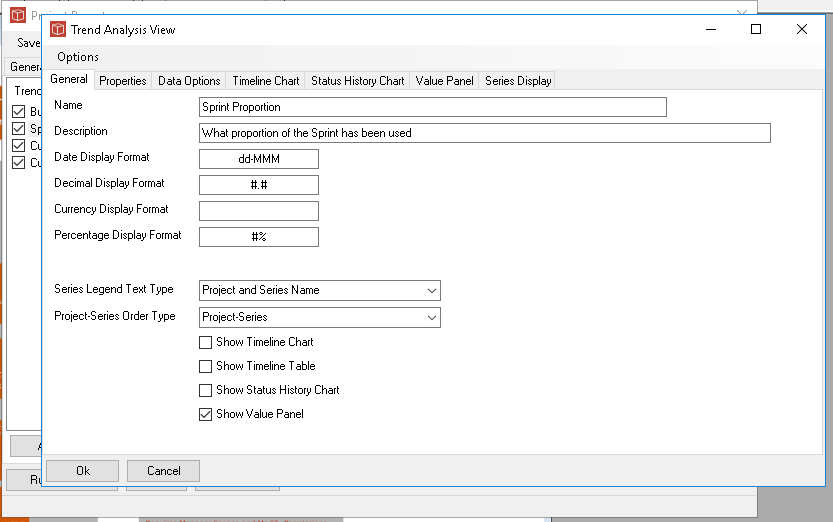
New blank trends can be added and then within the pop out trend form you can set up the type of trend you want from scratch or load a saved one. The trend form allows you to choose one or more of the available types using the tick boxes and then to configure these using the subsequent tabs. All types Timeline chart, Status History chart and Value Panel are supported for project reports.
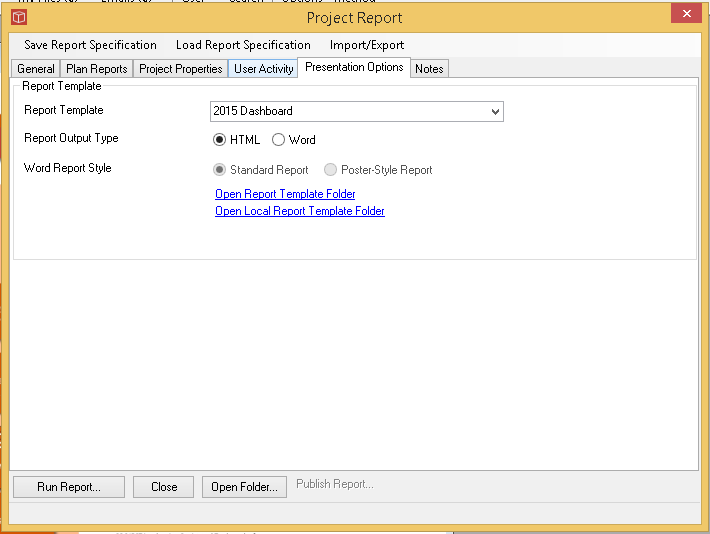
User Activity - Tick to select on and use the date filter if required to narrow the choice of activity data shown. Presentation Options -These will be included as part of your loaded report specification and consist of the Report Template (the definition, layout and styling resources for the report), the type of output (to html or word) and if word has been chosen then whether a standard report (including all sections specified) or a poster (use the explicit sections and layout prescribed). If you want to customise your own report templates do so in the Local Report template folder otherwise they may be overwritten by centrally managed updates into the controlled Report Template folders.
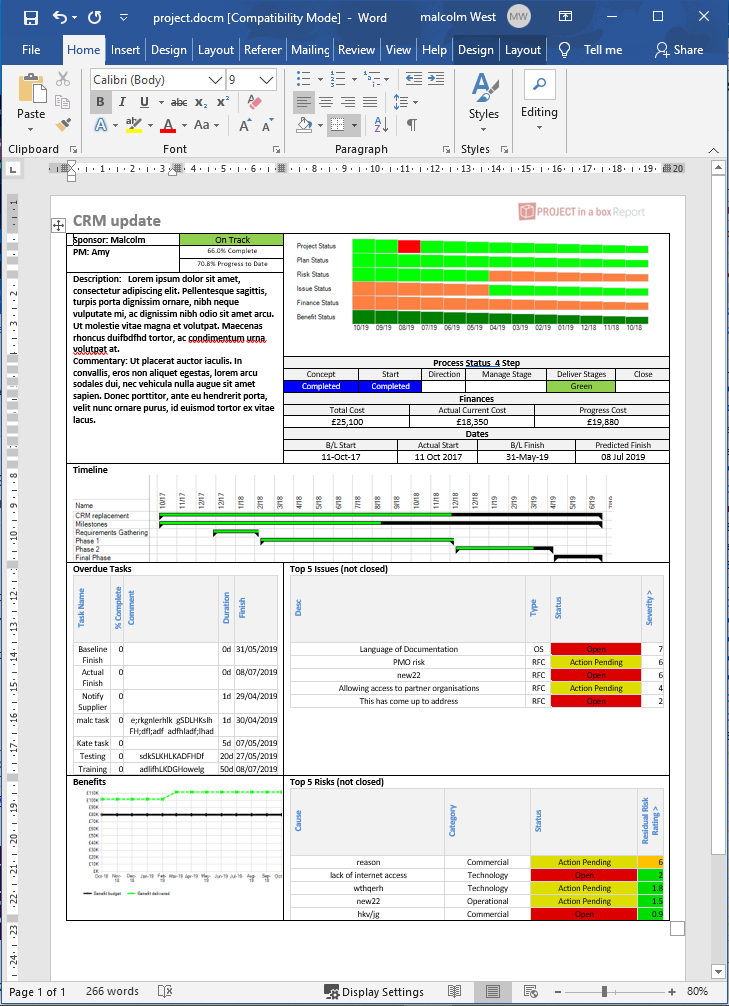
To generate the report press run report. You can also use the Open folder... button here to open the appropriate report storage folder and view previous reports for this project or package a report for distribution. A Publish Report... button is provided at the bottom of the form and initially greyed out until the report production is complete and the output has been viewed, then it becomes a lit hyperlink. Clicking on this link opens the Publish Report form with the source file details of the report you have just produced populated. You can use this form to publish your report to the Enterprise hub for easy sharing with your colleagues. and wider team. Should any of the requested data sources not be available you will be advised of this in a message box before the produced report is shown to you. Once you have a report you are satisfied with the settings will be retained by the form until you change them, either manually or by loading a different existing report definition. To save your current report arrangements use the Save Report Specification item in the menu, give it a name and choose a type (Gobal, Project or My) depending on your permissions. If you are an admin user you can save to any of the three formats and even overwrite the existing specifications, other Modify and manager users can only save to My or Project level report specifications.
|