Editing Views
As we can see the View is very important in controlling how our data is presented in the Task, Risk, Issue and Resource analysis forms. Although lots of the time we will be using preset views from the picklist we can also edit or change these views to personise the analysis. The edit view form is very similar for tasks, risks and issues. Although there are some differences we will look at these as one item and note the differences as they arise. Resources are more different still and are dealt with at the bottom of this section.
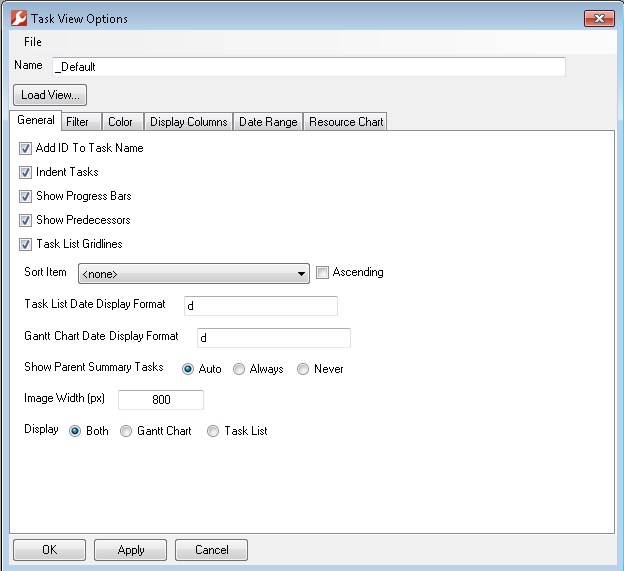
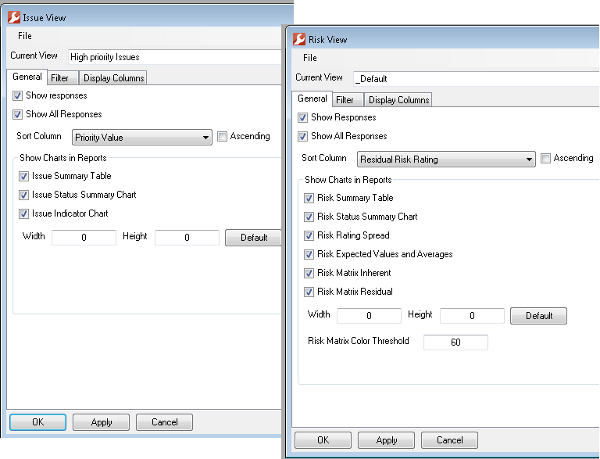
This is the form used for editing Task filters and has the most tabs, risk and Issue forms both also have General tabs although the items on them differ but all three have filter and Display columns tabs. The General tab shows the settings for display format and also sort item. The other key purpose of the general tab is to dictate which types of display are required i.e. in Tasks display of Gantt, Task list or both, nad in the risk and issue forms ticking which charts to include/response inclusions in the display (for reporting and Browser App). The size of the images to be generated can also be set and this is very useful when the view is being used to set up data for reporting into a space in a report.
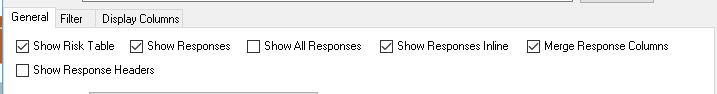
When working on Risk and Issue views there are now (version 5) many more options regarding how to display responses as shown here below (these option are identical for both risks and issues):
Firstly choosing whether risks and or response tables are displayed at all. Then whether to show all responses or just those associated with the selected risks/issues (this applies to the live use of the form not to reporting). the Default is to show two separate tables one for risks/issues and the other for responses. By selcting to show responses inline the responses will be inserted in the next row beneath each parent item in a single table, response headers being included optionally. By also selecting Merge columns the responses can be brought into line to the right of the parent item in a wider display. The filter tab allows the different rule types for each analysis to be applied to the data to control which bits are shown. Multiple filters can be used together to create a combined effect and data will only be shown that meets the requirements of all filters which are operational.
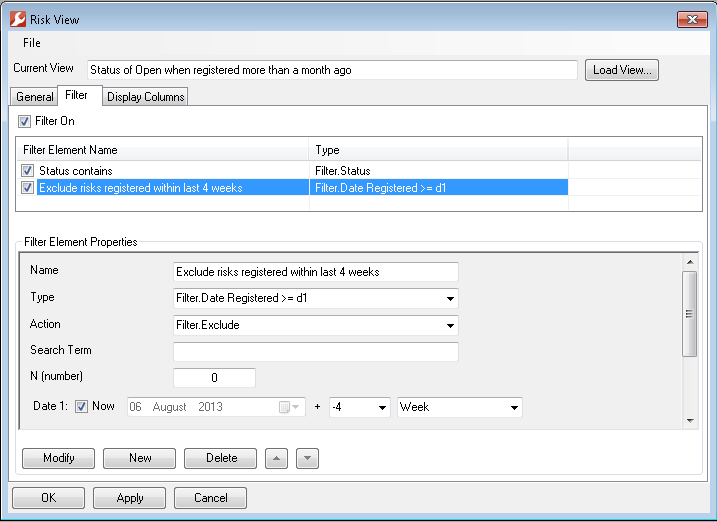
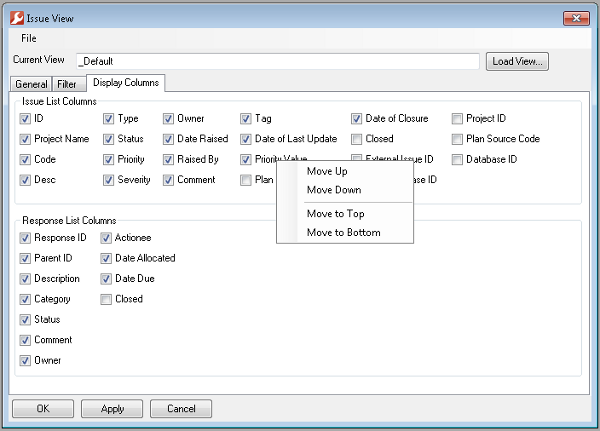
The example here from risks shows two rules which only shows data where the status matches a required value (they are still open)and where the any risks registered within the last four weeks are ignored. To modify or add a new rule element set this in the lower form selecting the type from the available options and the action of whether data matching it should be included, excluded, highlighted or lowlighted. Tick at the top shows whether the filter is set to run within the view. Different filter rules types can be set to look at date items (which support absolute dates or dates relative to now), text search terms in such fields like comments or names, number matches or greater than/less thans in financial or value type fields. When used in combination this leads to pwerful capbilities. Each analysis type has as standard a view which has all the filters pre set up bu switched off so you can easily activate the required combination and selet the values you want. The display column tab allws you to switch on and off and change the order of display of columns into the data lists. Switching on and off is done with the tick boxes and right click on the item to see its move menu. In practice moving is easier to do by using ok on the form then drag and drop columns as required in the analysis form and then re check the edit view form to see your changes.
The Task form also has two further tabs:
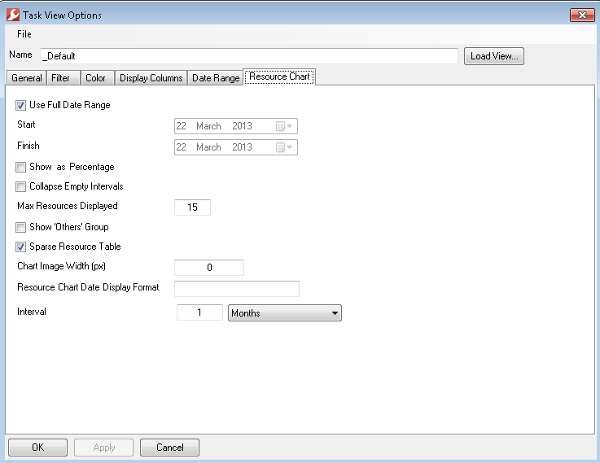
The Task endit View options form also contains a tab called Resource Chart. This isn't used by the task form but is used when that view is loaded for a Resource form. When editing the view from a resource form the only tabs available for use are the Resource Chart tab (this has the following controls for editing the display of the resource chart and resource table) and the Filter tab. The main points here are the date range (default or between two set absolute dates), show results as % instead of total number of hours (this takes up less space in a crouded chart) and the Interval where the chart can be displayed in day, week, month or year blocks. To display in Quarters select Months and the number 3.
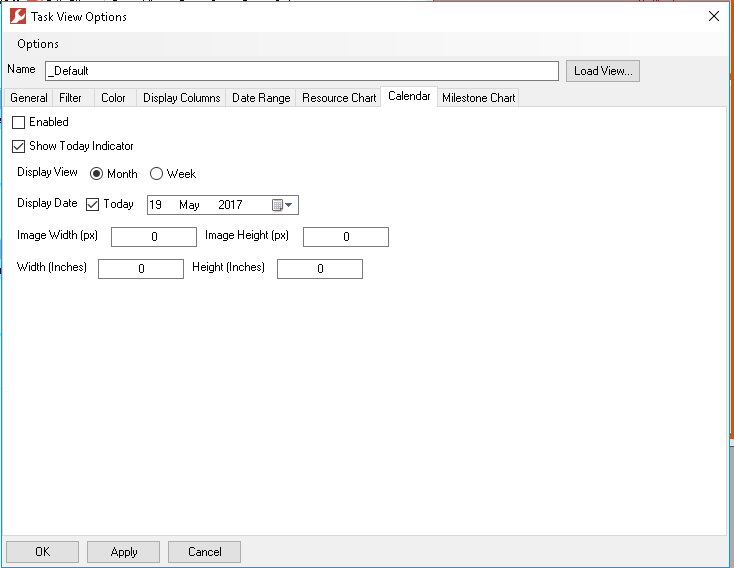
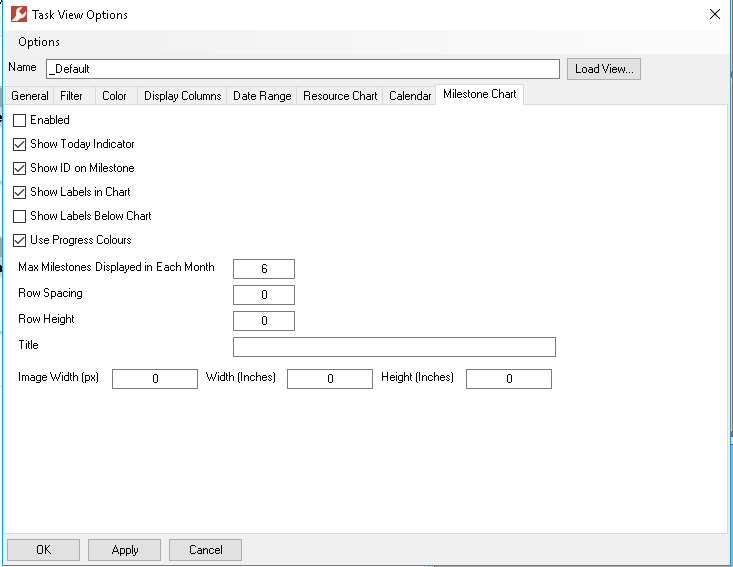
Press OK to see thae changes you have made have effect on the analysis. Please note that using any reset buttons in the analysis menu will lose any temporary changes you have made. To save your changes as a new view for use again later see the saving and managing views item. Note that since version 5.0 there are now tabs as part of the view for saving the specification and setting of both the Calendar and Milestone Chart displays as shown below. When producing outputs for reports he enabled box determines which images will be generated in the report data. On the General tab of the Task view the Gantt chart 'None' option cna disable the gantt and task list so only the calendar or milestone time line appears.
|