Project Controls
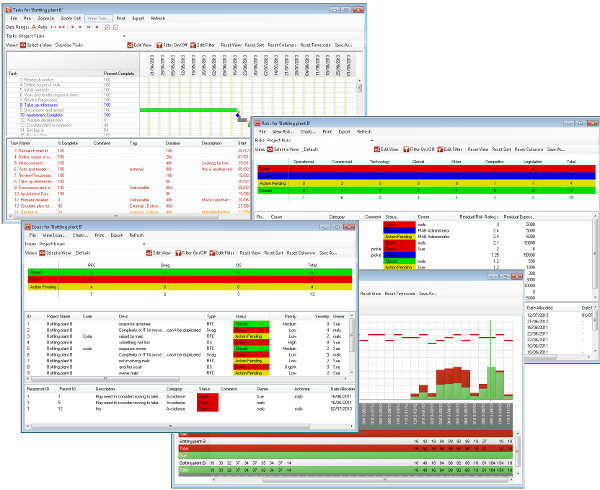
Your project will have key data used to monitor and manage its performance and compare it with other projects. This Project controls data is risks, issues and tasks drawn from plans. The data is collected automatically from source files held in the project and loaded into a database everytime the file is checked back in after updating. The data is available to feed notifications, reporting and dashboards but here will will discuss the live analysis of these data types.
When doing this analysis we can look at four different data types:
Each of these area can be examinined within a particular scope of data i.e. at the project level, portfolio or programme level or across the entire system for a particular user etc. and other options depending on your permissions in the system. In addition Views can be used to filter the degree of data shown in a number of ways and the display rules and arrnagements changed. Pre saved views allow changing of the focus of analysis quickly and custom views can be created and if required saved and shared for custom analysis. Using this combination of data type, scope and view gives the user great flexibility in the analysis they do and a great many combinations so the help will go through the different aspects of project Control analysis rather than a detailed review of views on each data type. A fifth type of data is collected from planner files alone and this is Assignment data. The actuals information on the amount of time a user says thay have worked on a task against the amount allocated to them. This data is made available to you in the Plan Assignment Report. |
