Tasks
The task analysis window gives you a place to see the information about tasks that you might be interested in. What you see varies depending on the Scope of data currently selected (i.e. the project, all my tasks, tasks for PM in the portfolio) and the View being used (i.e. Overdue tasks, tasks starting next week, costs etc). It is important to remember that this is not a place for adding, editing or updating tasks, this is done by working on the original source file in the document management area of the project. Here you can analyse, print and export data about the tasks topic.
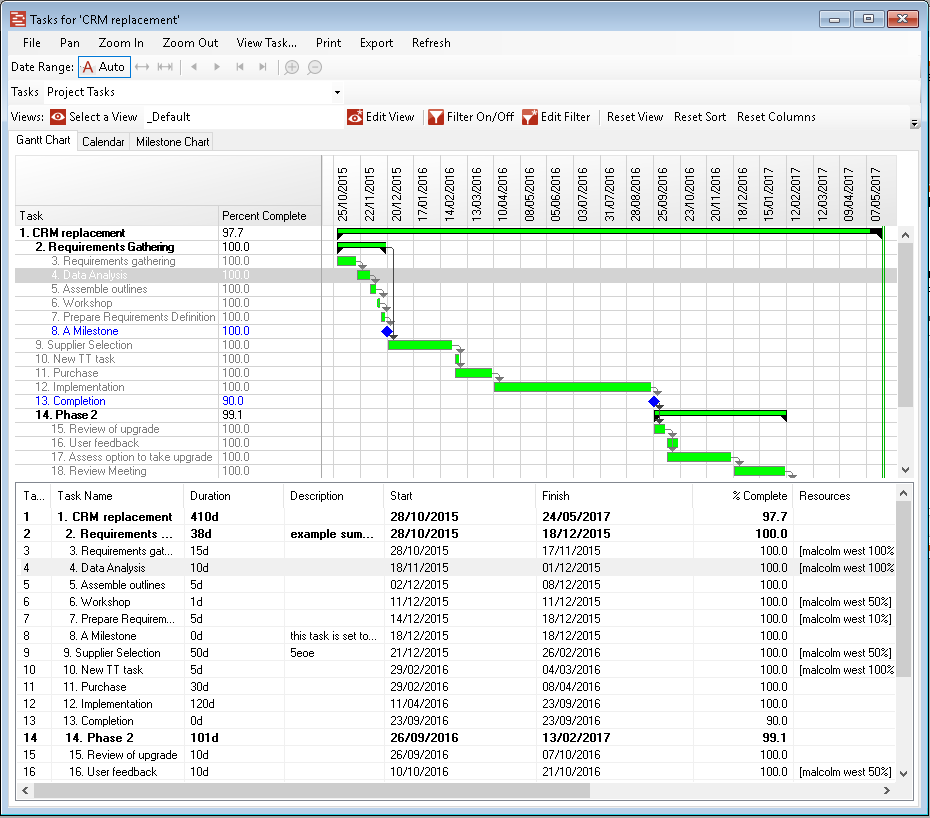
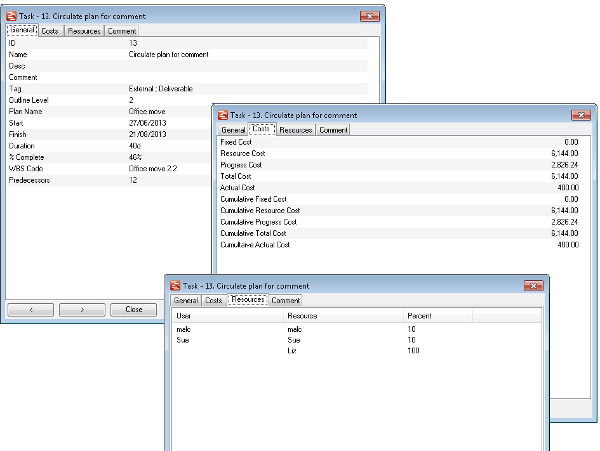
The presentation in the lower part of the form is in three tabs Gantt Chart, Calendar and Milestone Chart. The defualt display usually consists of a gantt chart display in the upper part of the form and a task list below. The following sections relate to interactiosn with the Gantt chart display, at the bottom of this article is information on the Calendar and Milestone displays. Clicking on an item in either part of the form will highlight it in the other part, clicking on either will open the task details form. The task details form as shown below provides all the details avialable for that task, if the task comes from a Planner file then the data set may be much more complete and include cost information.
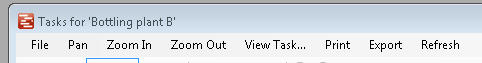
Focussing now on the menus of the task form. Firstly we look at the main menu.
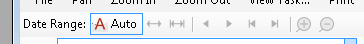
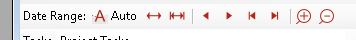
Next is the Date Range ribbon, this can be in auto modeor available for manual operation as shown in the two views below, the mode is set in the View but can be toggled on/off with he Auto button ( blue outline indicates it is on): Auto mode Manual mode The buttons have the following capabilities, in turn:
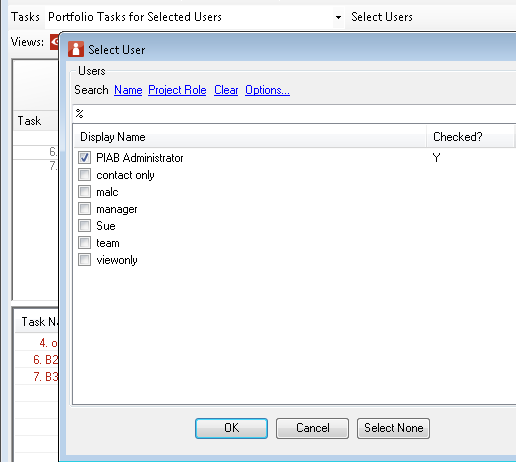
Next is the Scope of data form which allows the avialable data for analysis to be changed. When a scope which includes selecting specific users is selected an additional form to to this user selection can be accessed from the 'select users' link. A combination of users can be picked from the list, or searched by name, project role etc.
The final menu is the view menu (shown here in two parts)
Here the user can select the View they wish to apply to the data and see the currently applying view. further choices are as follows:
Calendar and Milestone Displays. Above refers to using the Gantt Cahrt display by switching tabs you can access the other two display types, firstly Calendar control as shown below:
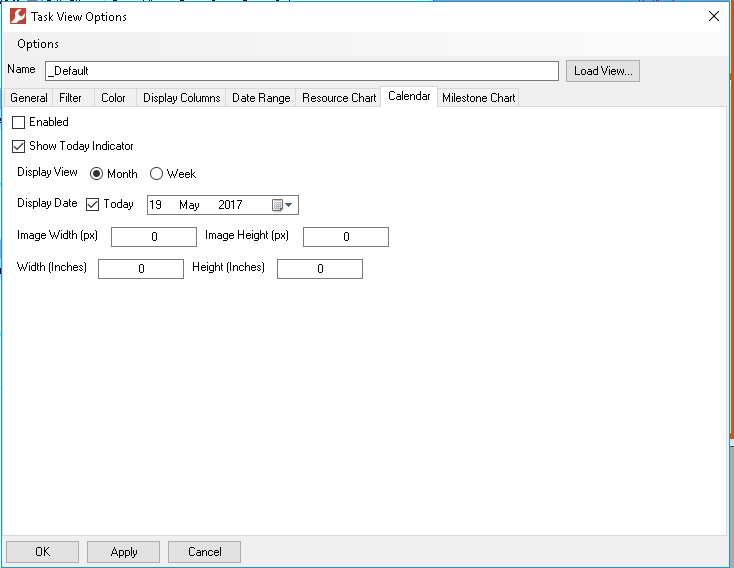
The calendar display shows the tasks selected in the current view and data range on a calendar style layout. This display defaults to monthly but can be switched to weekly instead using the picklist. Tasks are shown using the colours set for them in the view with a heavy colour on the day they commence and a ligher trail beyond that. When a day has too many tasks to display in the space a '+1...+n' indicator appears next to the date. The today button and the month navigator allows you to move around the periods within the data. If hover is switched on then you will get basic info about a task by hovering over it. to see the full task details simply click on it. The view controls the set up of this Calendar as seen below and adjustments can be saved into your views.
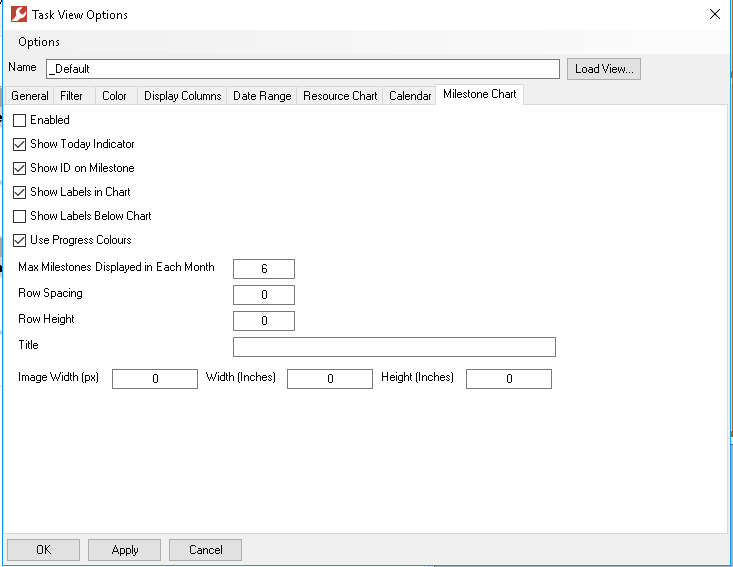
The size settings in pxs and inches ontrol the size of the calendar when it appears in reports. The Milestone Chart displays all the milestones included in the current datarange and view on a project timeline, as shown below:
The milestones are displayed as diamonds with colours automatically generated based on the date the milestone is due and the current percentage complete of it. Every month in the data set is included although empty months are compressed and todays date is shown as a green line. Milestones can be clicked upon for full dtials or hovered over for basic info. The view allows you to set the depth of the row (and therefore how many milestone detials will be included) also the location of the milestone name etc.
|