Resources
The resource analysis window gives you a place to see the information about tasks that you might be interested in presented as a resource chart. What you see varies depending on the Scope of data currently selected (i.e. the project, all my tasks, tasks for PM in the portfolio) and the View being used (i.e. Daily, weekly etc). It is important to remember that this is not a place for adding, editing or updating tasks, this is done by working on the original source file in the document management area of the project. Here you can analyse, print and export data about the resources topic.
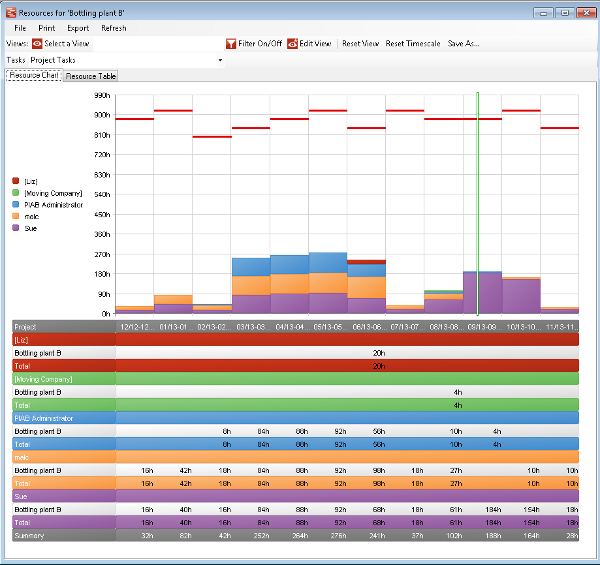
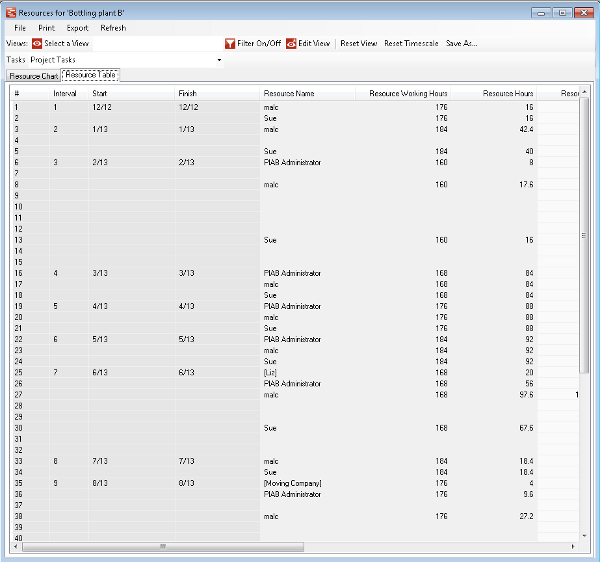
The presentation of resource chart consists of a resource bar chart and a colour coded table of recources beneath as above. The alternative tab of Reource Table shows a tabular presentation of the data as below.
Focussing now on the menus of the task form. Firstly we look at the main menu.
The next menu is the view menu
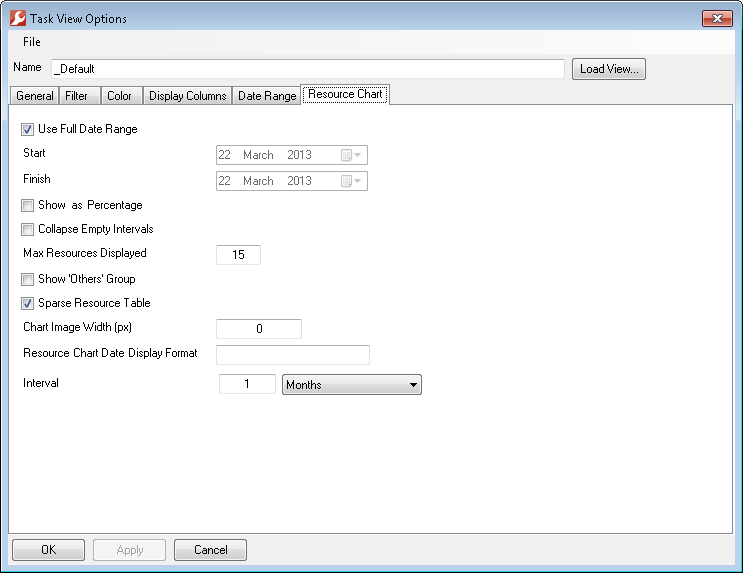
Here the user can select and edit the View they wish to apply to the data and see the currently applying view. In editing a view from the Resource form you can only change the Filter and Resource chart options in the view form. These allow you to change aspects of the display and data feed but other aspects such as colours and timescale are dealt with differently in the Resource display. Notable options on the Resource Chart tab are changing the interval to days, weeks etc and narrowing the display date range from the default.
Finally is the Scope of data form which allows the available data for analysis to be changed. When a scope which includes selecting specific users is selected an additional form to to this user selection can be accessed from the 'select users' link. A combination of users can be picked from the list, or searched by name, project role etc. |


