Using Views
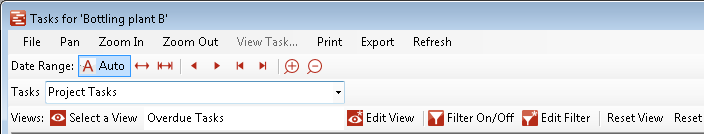
Whilst the scope of data you select in your analysis window defines the outer extent of the results you can analyse the view controls how you see that data and potentially narrows it further to filter or restrict the data. Although the contents and coverage of what the view controls is different in each analysis type (risk, issue, task and resource) all of them support the concept of a view, they are selected, applied, edited saved and managed in the same way. Your project control analysis form will remember the view you used last timeyou opened the form and this current view is always displayed below the scope of data as show here with the current view of Overdue tasks:
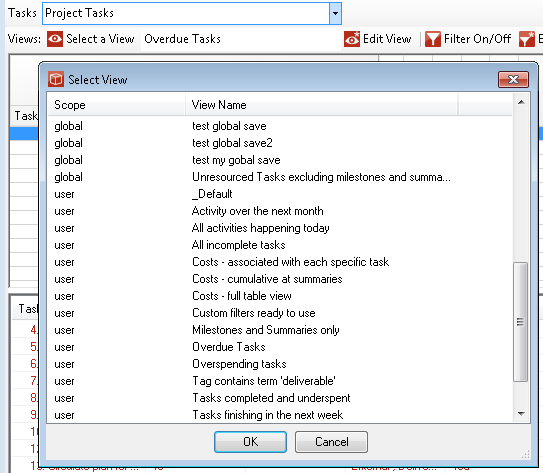
To change the view to choose one of the available existing views click Select a View and pick from the list. The list will show the appropriate view available, so a Risk form will only show saved risk views and some will be clasified as:
selecting a new view will see its instuctions followed in the display. Rather than selecting a new view you can take the current view and alter or personalise it. This will be remembered until you choose a new view and if you want you can save it as Global,Project or User for reuse later on (depending on your permissions levels). The selected view can have a very significant impact on what you see in the analysis window, here are some of the major things the view controls:
For further details about what is included in each view see the editing a view section. |