Risks
The Risk analysis window gives you a place to see the information about risks that you might be interested in. What you see varies depending on the Scope of data currently selected (i.e. the project, all my risks, risks for PM in the portfolio) and the View being used (i.e. top 10 risks by value, risks with probability >50% etc). It is important to remember that this is not a place for adding, editing or updating risks, this is done by working on the original source file in the document management area of the project. Here you can analyse, print and export data about the risks topic.
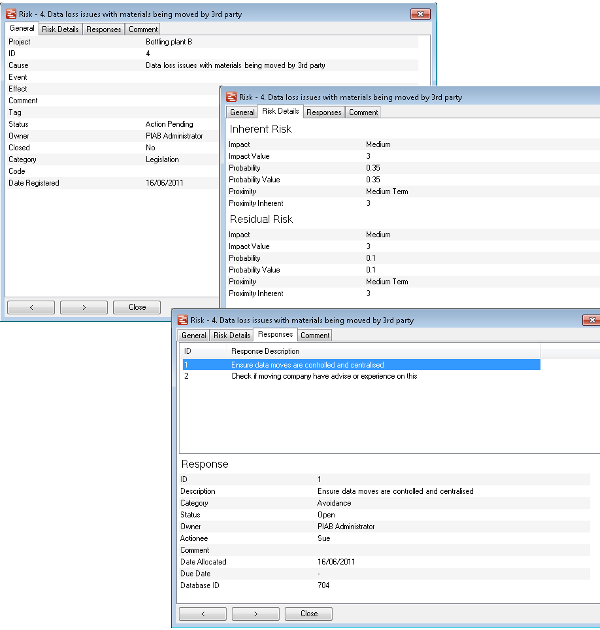
The presentation usually consists of a risk table at the top and a risk list in the centre, optionally there may be a responses pane at the bottom, for further details on a particular risk double click on it in the risk list. The risk details form as shown below provides all the details available for that risk, if the risk comes from a Planner file then the data set may be much more complete and include responses.
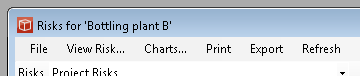
Focussing now on the menus of the risk form. Firstly we look at the main menu.
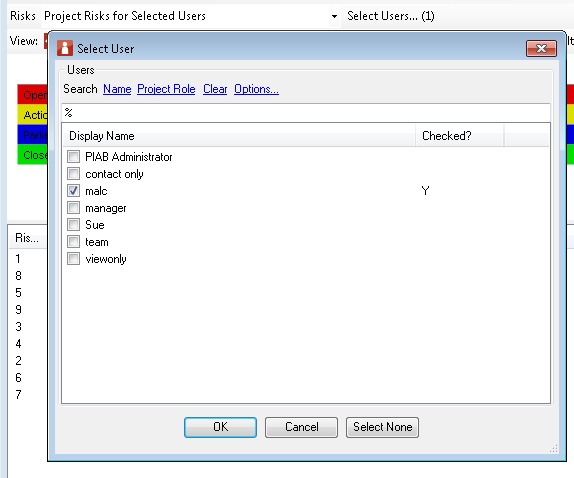
Next is the Scope of data form which allows the avialable data for analysis to be changed. When a scope which includes selecting specific users is selected an additional form to to this user selection can be accessed from the 'select users' link. A combination of users can be picked from the list, or searched by name, project role etc.
The final menu is the view menu (shown here in two parts)
Here the user can select the View they wish to apply to the data and see the currently applying view. further choices are as follows:
|