Edit Properties View
Editing the Property View allows a derivative or completely new view to be created and then if required saved for reuse by you or others. These views can be used in the Dashboard, Select Project form, the System project Properties form and also in project, portfolio and multi-portfolio reports. Selecting Edit View in these forms will lauch the Edit Property form with the current view displayed as follows:
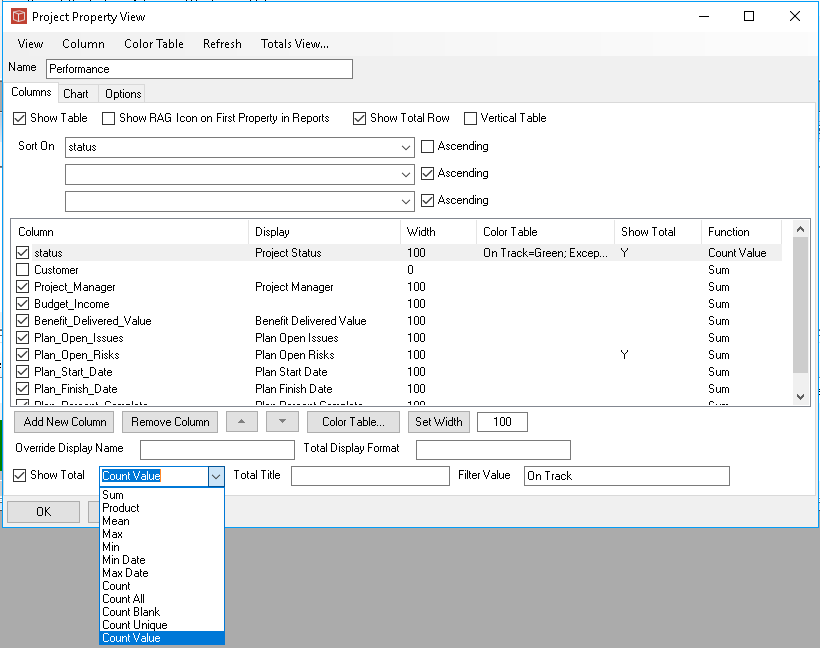
The form is in three tabs, Columns and Chart being the two main ones and a third for minor options. First looking at the Columns tab which controls the properties to be included in the view. The main part of the form shows the selected Properties as 'columns' ticked ones are active and unticked ones will not be displayed. Column display order is as they run down the form, this may extend onto additional columns. Tick items on or off as required and use right click options to change position in the list. Additional columns can be added either one at a time using the Add new column pick list or using the Column Menu Item and one of the all column options. Using the Add new Column menu Item you can choose from any of the available properties in the system (including System, extended, Project control or Project spreadsheet). Note when setting up a view here only the System Properties selected will be visible when the view is used in the System Project Properties edit forms. Columns can be removed in a similar way using either the menu item, by right clicking on a property or a bulk removal can be done from the Column menu item. You can also choose which column(s) your data will be sorted on. If no option is selected the order will be alphabetic on Project Name. If sort columns are selected then a final ordering will be automatically added which will be alphabetic on project name. You can also select whether RAG icons are to be used (if available) for data in the first column. Also once the coloumn is selected you can set it to be totalled and you can define a colour table for that property type using the Colour table button. Total rows are only displayed when the view is used in a report. When using the total feature you can set the type of total or summary to be used with the pick list and if using count Value the Value filter must be completed. You can also choose to give your total a title which is helpful when further rolling up data at the multi-portfolio report level. Your view will be active when you close this Edit form and return to your original location where the view is being used. If you want to save this view though for others to see or for you to switch between or pick up in a different location Use the View menu and save View. Here you can choose a view name when saving. If you want to edit another existing View use the View menu and select load view, pick from the list of existing views and this will populate the form as discussed above. The View Menu item will also let you take a copy of the view definition as XML which can be stored or passed to a colleague. The same menu also offers a paste facility so you can add a complete view definitions passed to you in xml format by a colleague. When reporting from this view you can choose whether the table will be displayed using the 'Show Table' tick box. This is used so that the table can be hidden and just the chart displayed. The Chart tab allows you to define a chart based on one of the properties in the view. These charts are only produced into Portfolio reports and are not shown in project reports, project selector or Project System properties grids. The Chart is also optional on reports and can be selected/deselected with the 'show chart' tick box.
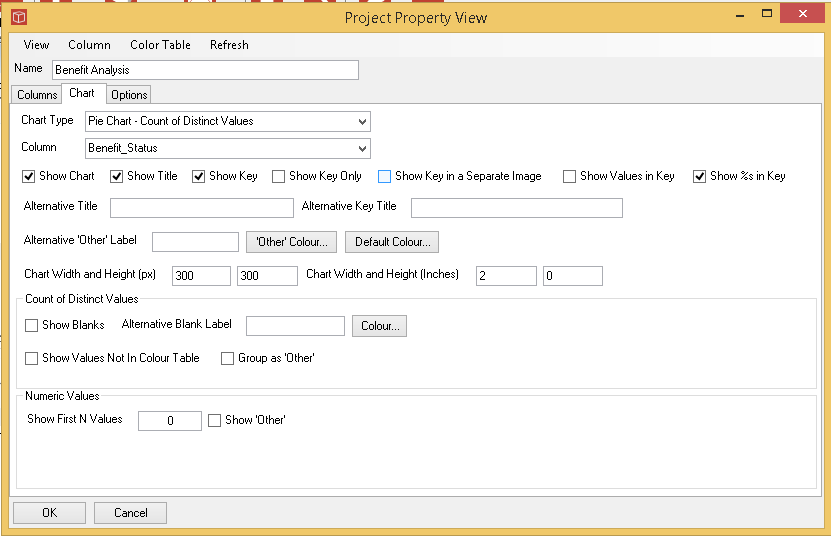
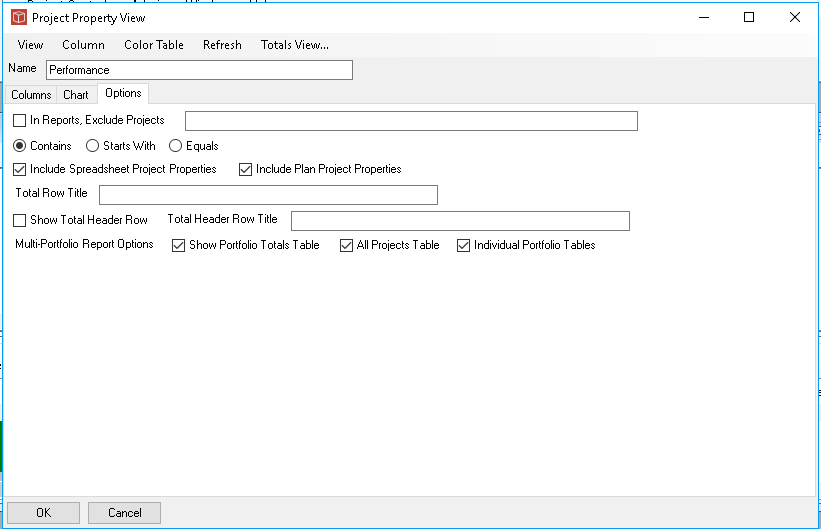
Four Chart types are supported and work on the selected column (which shows the properties set up in the Columns tab): 1 - bar chart - count of distinct values 2 - bar chart - Numeric values 3 - pie chart - count of distinct values 4 - pie chart - Numeric values When using a bar chart the scale of the axis will be set by the values in the data. When using a pie chart the segments will scale back from the whole Pie in 1% of total being 3.6degrees of rotation. The size of the pie does not indicate anything related to the total value. When presenting Numeric values the colours are determined by the colour table associated with the property being charted. If there is no colour table set for property then a default colour set will be used. When lots of projects are being displayed the Numeric Vlaues options allow you to decided to show the first n and then either ignore the remainder or group as other. When presenting Count of distinct Values counts will be determined byany associated colour table. If no Colour table is set then one will automatically be created There are then options for how to deal with the items which didn't match a colour table entry. These are in the section titled Count of Distinct Values. All the cahrts use the same set of options for determining the output size (pixels for use in HTML reports i.e. for Dashboard display or inches for when being inserted into Word reports). Total and Key options can also be used where required. The Options tab give the ability to exclude property data from the reports when operating at a portfolio level.
In the example here a portfolio report would usually show data in rows for say 20 projects in the portfolio, but here any projects which include HR in their project title will be excluded. The tick options to include Plan and Spreadsheet properties are a legacy item and should be left switched on. There are also options here to support the additinal Title row and to manage where the Multi-portfolio report. |