PSI - Spreadsheets
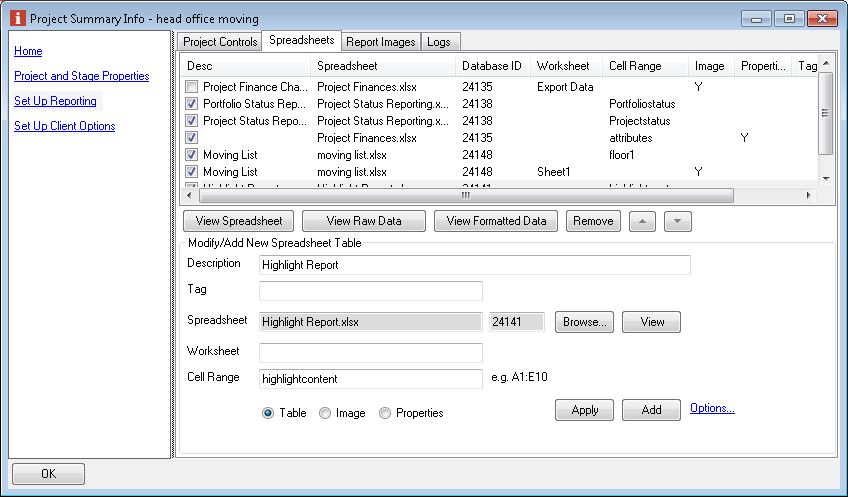
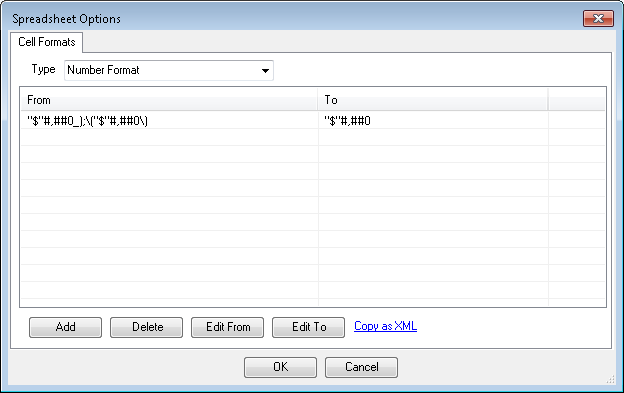
When reporting on a project you can automatically include content from any of your spreadsheets held within the project. Including these elements is activated if they exist with a tick box in the Portfolio report , Dashboard or Project report wizards. Which spreadsheets you want to include and which particular parts of them is defined on the 'Spreadsheets' Tab of the Project Summary Info form for each project. This tab is visible in both the Home and Set Up Reporting topics. To add some specified content go to the area at the bottom of the tab, click on browse, find and select the spreadsheet file you want to extract content from. The file must be part of the current project and be a supported excel file i.e. .xls, .xlsx or xlsm. Three types of data can be defined, tables, images or properties. Tables are more broadly applicable and will return the selected data range following interpretation of rules into the output report. The Images mode will return any images from that worksheet to the output report, often charts (once converted into images) etc. The Properties mode populated the project properties with data/text against the property names specified in the data block. Once the file is identified it will then show in the spreadsheet area of the form and may be given a description/title, now use the View button to open the spreadsheet. Identify which cells you want to include and which worksheet these are in. If you want to include a range of specific information dotted around the spreadsheet we suggest you add an export worksheet and group your content together into a single area with appropriate titles and notes.NB Important: When specifying any part of the worksheet or named range name please be aware that it is Case sensitive. (remember you will need to first checkout the file to save these changes). Return to the Spreadsheets tab and type in your worksheet name and cell range into the spaces on the form. Note: take care with format and spelling, in particular the cell range needs to be in top-left to bottom-right format i.e. A2:B6 will contain 10 cells (five rows in two columns), any notes, titles and data processing codes will need to be included in the cell range specified. When complete, click the Add button and your entry will be shown in the list at the top of the tab, this content will now be included in reports for this project when the option is selected. To edit an existing entry, click on it in the top list to select and then alter the entry in the lower form ensuring you use the modify button to save any changes made. Spreadsheets can also be removed from the reporting by clicking to select and using the remove button in on the upper form. Once your reporting elements are set up you can view the raw returns or the formatted outputs by selecting the source in the list and using the buttons. When bringing back data for a table the reporting will bring much more from Excel than the data, also formats,colours merge cell instructions etc. These can be viewed in detail in the raw data form which will show how the system has tried to match the excel number and date formats to those available in HTML. If you want to alter these approaches including adding your own you can do this with the options... form from the link on the form.
From version 2.5.1 it is also possible to have your custom spreadsheet data rolled up at a portfolio level using the Portfolio Report Aggregation pattern (external link to knowledge base). When then running a Portfolio report it will try to merge together any data held in blocks defined with the same Description (so this name used above is important and if loaded from the Method Template shouldn't be changed). If the Description field is empty it will look for the named range of the data or the spreadsheet/wordsheet/cellrange string to combine the datablocks. As shown in the link this will only be attemted for spreadsheet data blocks which include the code [portfolio include]. |